
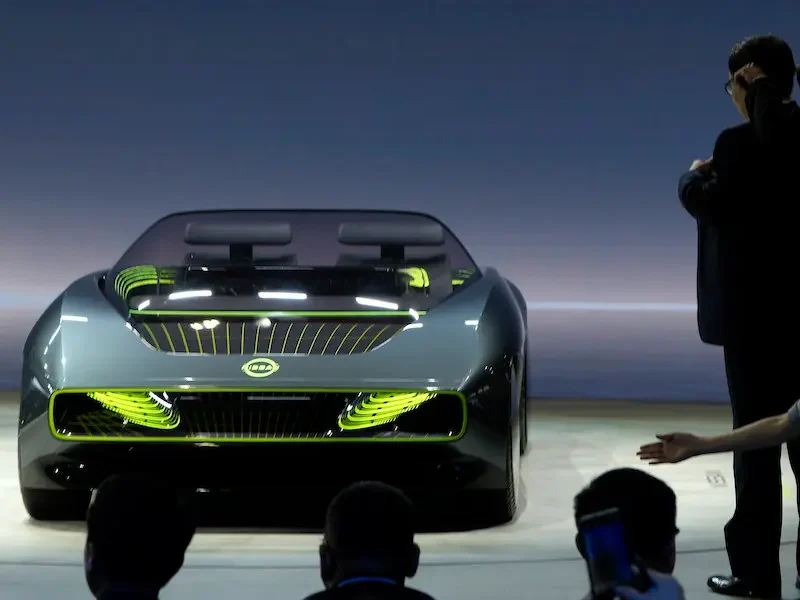
How Nissan Plans to Conquer the World
Nissan is partnering with China to tackle the global electric vehicle market. To outdo its competitors, the Japanese automotive giant must employ every conceivable tactic. China is already leading the electric vehicle front, and Nissan also wants to turn this to its advantage. The automotive giant will allow China’s leading universities to assist with the…
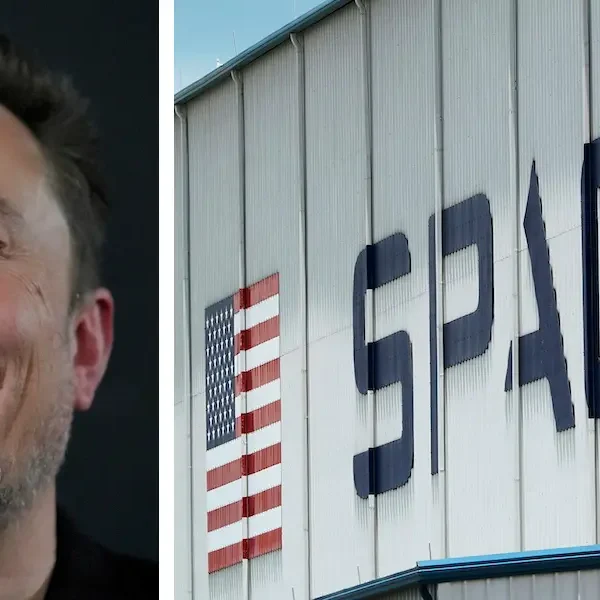
SpaceX Exceeds Expectations – Here’s How Much the Company is Worth
Elon Musk can laugh all the way to the bank – now his company SpaceX is worth more than Boeing and Lockheed Martin. The space and…